Most robot projects are rejected on a payback number that was calculated wrong. Not fraudulently wrong — just optimistic: labour counted at full cost, utilisation assumed at 100%, and integration, spares and downtime left out. A defensible ROI uses conservative inputs and shows which ones matter.
This guide gives the formula, the cost and saving categories, two worked examples with Indian numbers, and the sensitivity check that separates a real business case from a spreadsheet wish.
The formula, plainly
Annual net benefit = savings + added output value - operating cost
Simple payback (years) = total installed cost / annual net benefit
ROI (%) = (annual net benefit / total installed cost) × 100
Simple payback ignores the time value of money. For a five-year decision, add discounted cash flow and calculate NPV or IRR; a project with a 3-year payback and a 6-year life is usually strong, but the discount rate matters when comparing options.
Costs people forget
| Category | Typical share | What to include |
|---|---|---|
| Robot and controller | 35–50% | Arm, controller, teach pendant, licence |
| End effector | 5–15% | Gripper, welder, vacuum, tooling |
| Safety | 5–15% | Fencing, scanners, interlocks, risk assessment |
| Integration | 10–25% | Programming, PLC handshakes, conveyors, trials |
| Civil and utilities | 2–10% | Foundation, power, compressed air, network |
| Training | 1–5% | Operators, maintenance, programming |
| Spares and service | 3–8% per year | Consumables, preventive maintenance, support |
| Downtime during ramp-up | 2–8% | Lost output while the cell is tuned |
Savings that count
| Saving | How to value it | Common error |
|---|---|---|
| Direct labour | Loaded cost of hours actually removed | Counting a full salary when the person is redeployed |
| Rework and scrap | Measured defect rate × cost per defect | Assuming zero defects after automation |
| Throughput | Extra good units × contribution margin | Counting extra capacity that cannot be sold |
| Safety | Incident history, insurance, absenteeism | Using a round number with no baseline |
| Energy | Metered before and after | Ignoring the robot’s own consumption |
| Quality consistency | Customer rejects and warranty claims | Double counting with scrap |
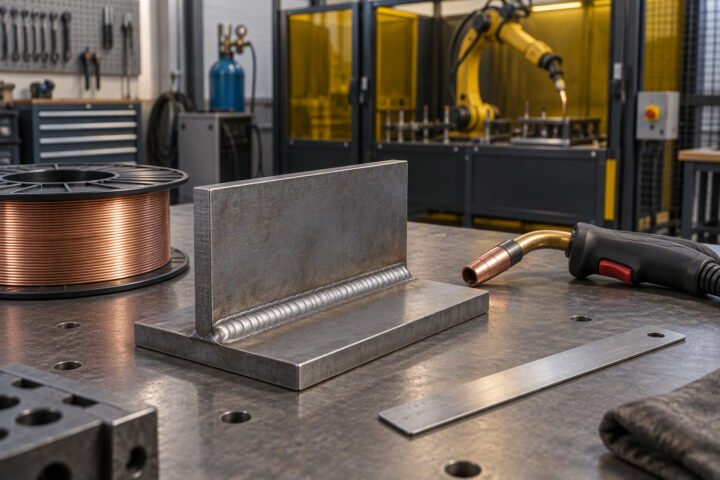
Worked example: cobot welding cell
A fabrication shop runs two shifts with one welder per shift. Loaded cost is ₹30,000 per month per welder, or ₹7.2 lakh per year for both. The shop buys a cobot welding cell for ₹28 lakh installed, including fixture, fume extraction and training.
| Line | Annual value |
|---|---|
| Labour released (one welder per shift, redeployed to fitting) | ₹7.2 lakh |
| Extra output from longer arc-on time | ₹3.5 lakh contribution |
| Rework reduction | ₹1.0 lakh |
| Consumables, power, service | -₹2.5 lakh |
| Net annual benefit | ₹9.2 lakh |
| Simple payback | 3.0 years |
That is a defensible case at two shifts. At one shift, the labour saving halves and the payback stretches past five years, which is where most small-shop welding projects fail.
Worked example: warehouse AMRs
A distributor runs three material handlers per shift at ₹25,000 per month loaded, or ₹9 lakh per year. Two AMRs with charging stations, fleet software and integration cost ₹18 lakh. Operating cost is ₹2 lakh per year.
| Line | Annual value |
|---|---|
| Labour released (two of three roles) | ₹6.0 lakh |
| Overtime avoided during peak | ₹1.5 lakh |
| Damage and mis-picks reduced | ₹0.8 lakh |
| Operating cost | -₹2.0 lakh |
| Net annual benefit | ₹6.3 lakh |
| Simple payback | 2.9 years |
If the third person is not actually released, the case collapses. That is the single most common failure in AMR business cases: the labour is “saved” on paper but still on the payroll.
The sensitivity that matters
Utilisation drives everything. Run the same welding cell at different utilisations and the payback moves more than any other input.
| Utilisation | Net annual benefit | Payback |
|---|---|---|
| 50% | ₹4.6 lakh | 6.1 years |
| 70% | ₹6.4 lakh | 4.4 years |
| 85% | ₹7.8 lakh | 3.6 years |
| 95% | ₹8.7 lakh | 3.2 years |
Before signing, ask what utilisation the vendor assumed. Then ask what happens at 60%. If the answer is “it still works”, the case is robust; if not, the risk is yours.
A one-page template
- Task, cycle time and annual volume.
- Current labour hours and loaded cost per hour.
- Installed cost, broken into the categories above.
- Annual operating cost, including spares and service.
- Savings with a baseline for each, and who verified it.
- Utilisation assumption and the payback at 60% of it.
- Ramp-up period and the cost of lost output.
- Exit cost if the project is cancelled after year one.
Mistakes that inflate ROI
| Mistake | Effect | Fix |
|---|---|---|
| Counting full salaries as savings | Payback understated by years | Count only hours actually removed |
| 100% utilisation | Ignores changeovers and faults | Use 70–85% and test at 60% |
| Ignoring integration | 20–30% budget overrun | Get a fixed integration quote |
| Zero ramp-up time | Output loss not counted | Add one to three months of reduced output |
| Double counting quality savings | Inflated benefit | Separate scrap, rework and warranty |
| No maintenance plan | Downtime after year one | Budget spares and service annually |
Related: industrial robot cost in India, cobot buying guide, palletizing robot cost, machine tending robots, robot maintenance checklist.
How do I calculate robot ROI?
Divide the total installed cost by the annual net benefit to get simple payback. Net benefit is savings plus added output value minus operating cost. For longer projects, also calculate NPV or IRR.
What payback period is acceptable for a robot?
Most Indian manufacturers look for two to four years on a robot cell. Projects beyond five years are usually hard to approve unless there are safety or quality reasons.
Should I count labour savings if the worker is redeployed?
Only count the value actually captured. If the person moves to another productive role, the saving is the difference in output or cost, not the full salary.
What utilisation should I assume?
70 to 85% for a well-run cell. Test the business case at 60% as well; if it still works, the project is robust.
What costs are usually missed?
Integration, safety, civil work, training, spares, and the output lost during ramp-up. These can add 30 to 50% to the robot price.
Payback depends on the install going right, which is why the robot integration checklist belongs in the business case.
ROI depends on the cycle time you actually get, so calculate it properly with the robot cycle time guide before signing the purchase order.
Welding is often the fastest-payback robot job in India; the welding cell cost breakdown shows where the money goes.
Renting changes the cash-flow profile, so run both cases through the rent versus buy comparison.
Warehouse projects often pay back on labour and space before any robot arrives, as the layered cost breakdown shows.
Take-out robots often pay back in under a year, and the moulding robot guide works the cycle-time maths.
If you are comparing process options, the laser welding cost figures give you the capex line for the model.
Bending cells pay back on changeover time rather than cycle time, and the press brake robot bending guide shows the arithmetic.
Electricity is a small but real line in the model, and the robot cell energy cost guide shows how to estimate it per cell.
Payback models live or die on the cycle time assumption, so use the cycle time calculation method before you trust a projection.
Capital-heavy projects need a defensible model, and the ASRS guide shows the throughput and cost lines that belong in it.
Assembly payback turns on volume and scrap rate, which is why the assembly break-even needs running before the enquiry.
Add integration and commissioning to the machine price before you trust any payback figure; the integration cost guide shows what that adds.
Model the project without any incentive, then treat any support as upside, as the MSME automation subsidy guide recommends.
A payback model built on a 95% OEE assumption deserves a reality check; the OEE calculation guide gives the arithmetic.
Use a realistic hourly cost from the robot cost per hour guide rather than the machine price.
Sources and further reading
- International Federation of Robotics — robot economics and installation data.
- ISO 10218 — safety requirements that affect cell cost.
- Bureau of Indian Standards — Indian standards relevant to machinery and electrical safety.
- Universal Robots — published application cycle times for cobot cells.